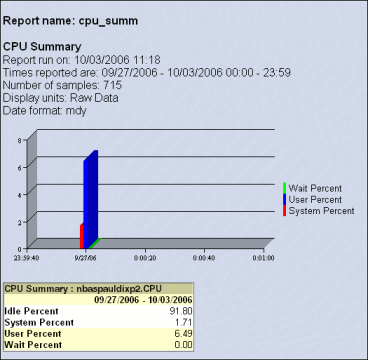
The following figure is an example of the type of graph that appears when you run the CPU Summary report without GRAPH1COLUMNS defined. In instances when you do not choose to define environment variables in the Environment field on the Create Report page, OpenEdge Management creates a report graph using the values associated with a report type's default fields.
The graph report output example in the following figure uses the values associated with the CPU Summary report's default fields.
Figure 1. CPU Summary output
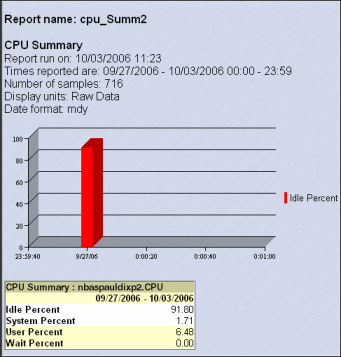
In contrast, the following code entered in the Environment field on the Create Report page shows how you can customize the graph output of the report by defining a field:
GRAPH1COLUMNS=CPU_Idle
When the CPU Summary report is run with this code, the data associated with the specified field appears. The following figure shows this customized output.