Try OpenEdge Now
skip to main content
Servers, DataServers, Messengers, and Adapters
Calculating Rule Threshold Settings Using the Configuration Advisor : Understanding the recommended threshold settings : Evaluating recommended settings : Using the Detail button
 
Using the Detail button
Each rule row has an associated Detail button.
1. view details about a rule's analysis, click Detail for a row. The Detail page appears.
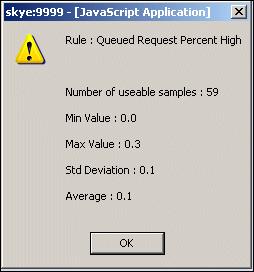
The following figure shows a Detail page, which presents the data used to evaluate the Queued Request Percent High rule.
Figure 50. Detail page analysis content
The following table describes the contents of the Detail page.
Table 48. Detail page fields and descriptions
This field . . .
Describes . . .
Number of useable samples
The number of data samples extracted from the OpenEdge Management Trend Database
Min Value
The minimum value derived from the data set
Max Value
The maximum value derived from the data set
Std Deviation
The root mean squared deviation
Average
The average value derived from the data set
Note: The Detail page for a rule for which there is insufficient data for analysis identifies the number of samples found. This number is always lower than the minimum of 32 data samples required. Review this data to help you decide if you need to expand the time period to try to capture more samples and rerun the Configuration Advisor for a given rule.