The administrator accesses the OpenEdge resources in the OpenEdge Management console, browsing to the AppServer resources. The network uses only one AppServer, thus the administrator can immediately click on either of the AppServer Operational views data—the Server Performance View or Broker Performance View.
Note: For detailed procedures on setting up and accessing AppServer resources, including the AppServer Operational views, see ManagingAppServer Data.
Scanning alert detail on the collection page and also on individual resources shown in the list frame, the administrator notices that there are no new alerts.
The administrator then accesses the Database page and scans for relevant information in the Operational views and Informational views sections. Finding no clues related to the issues, the Server Performance View details are shown next. The server state and server pool summary details that display in this view, however, are not helpful. In this situation, the administrator considers where the most valuable information would be found, and clicks on the Broker Performance View.
The following figure shows the data that appears in the Broker Performance View for the asbroker.
Note: In the figures presented in this section, the colors in the graphs are intended only to distinguish one data element from another.
Figure 54. Broker Performance View for asbroker1
The administrator scans the summarized data in Broker Requests, noting the fact that the total of Queued requests is almost the same as the total number of Rejected requests. At this point, the administrator knows that there is a problem in this area, but still needs to do more research. From the previous use of the data on the Broker Performance View page, the administrator knows that the AS Broker Activity Status graph is a representation of the Queued and Rejected values noted in Broker Requests.
The administrator clicks the binocular icon associated with the AS Broker Activity Status and the AS Broker Activity Status pinup appears, as shown in the following figure.
Figure 55. AS Broker Activity Status for asbroker1
The pinup graph in the above figure focuses on a much smaller time frame for the data, and the data confirms the very poor performance noted on the main Broker Performance View page. In fact, the number of rejected requests really is as high as the number of queued requests. What happened at the time frame indicated on the AS Broker Activity Status to cause this dramatic situation?
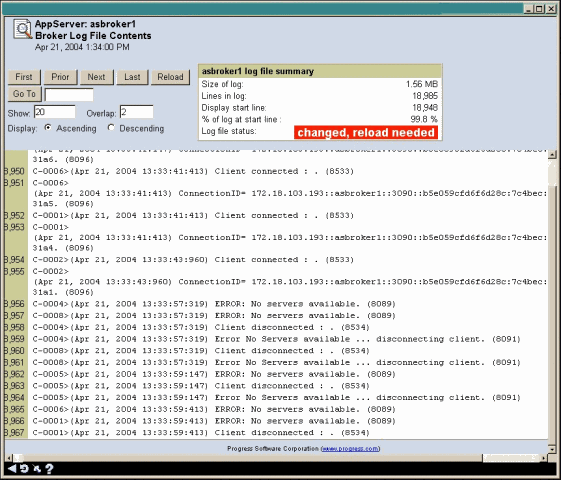
The administrator now decides to access the asbroker1's log file, hoping to find more evidence of these same difficulties. Note the several No Servers available and the Clients disconnected error messages in the log, as shown in the following figure.
At approximately the same time that the number of rejected requests was starting to approach the total number of queued requests, as shown in Figure 54, the error log reports that the servers are not available and that connected clients are being disconnected.
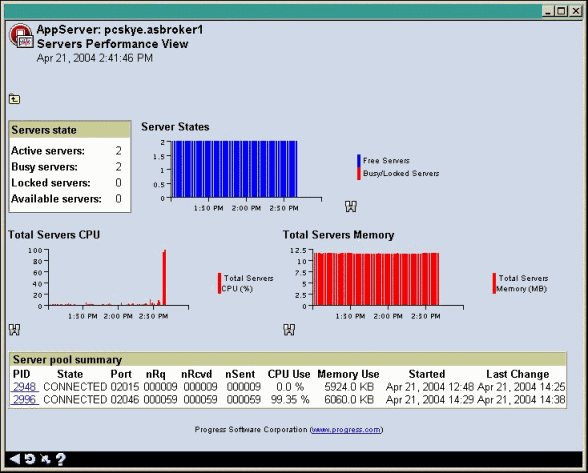
The administrator redisplays the Servers Performance View page. All the investigative activities have confirmed that a runaway AppServer process has brought down the network, leaving the users unable to perform their application transaction-related tasks.
The following figure shows the suspicious data in the CPU Use column, indicating that no CPU consumption is occurring for the servers.
Figure 57. Servers Performance View page for asbroker1
Again, by clicking the binocular icon, the administrator can display this data in a pinup, as shown in the following figure.
Figure 58. Total Servers CPU for asbroker1
By clicking on PID 2996 as shown in, the administrator can display the specific PID process ID number that is the problem process. By clicking the Kill button on the Broker process page, the administrator can terminate this process, ending the network and application difficulties.