
|
Field
|
Description
|
|
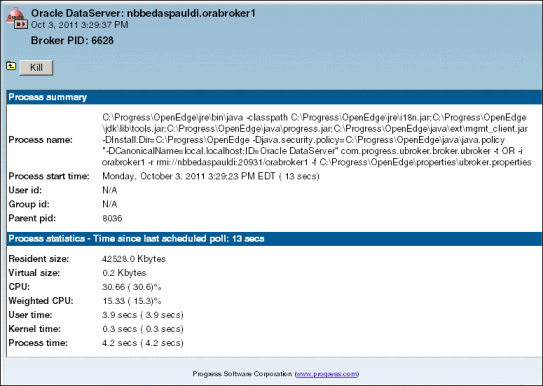
Resident size
|
The physical size of the process as defined by the host system
|
|
Virtual size
|
The virtual size of the process as defined by the host system
|
|
CPU
|
The percentage of time spent using the CPU in either the user or kernel mode since the last scheduled poll
|
|
Weighted CPU
|
The percentage of time spent using the CPU in either the user or kernel mode since the last scheduled poll divided by the number of CPU processors on the system.
This value appears only when there is more than one CPU process on the system where the process is running.
|
|
User time
|
The amount of CPU time spent in the user mode since the last scheduled poll
|
|
Kernel time
|
The amount of CPU time spent in the kernel mode since the last scheduled poll
|
|
Process time
|
The sum of the values that appear in the User time and Kernel time fields
|