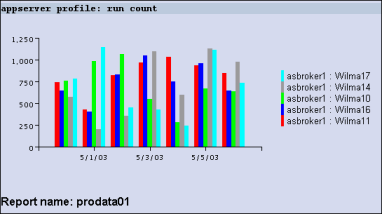
The following figure shows an example of the type of graph that displays when you run the AppServer Application Profile report without the GRAPH1COLUMNS or the fathomResourcesPerGraph defined. In instances when you do not choose to define environment variables in the Environment field in the Create Report page, OpenEdge Management creates a report graph using the values associated with a report type's default fields.
The graph report output example in the following figure uses the values associated with the AppServer Application Profile report's default fields.
Figure 3. AppServer Application Profile output
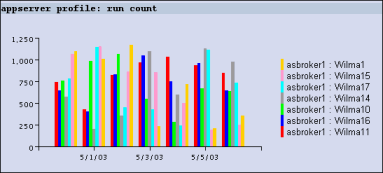
In contrast, the following information entered in the Environment field on the Create Reports page shows how you can customize the graph output of the report by defining:
Column headings for GRAPH1COLUMNS
Number of resources to display per graph for fathomResourcesPerGraph
When the AppServer Application Profile report is run with the following code, only the column heading-related data, with the specified number of resources per graph, appears: