You can monitor execution environment activity using the Statistics (-y) and Segment Statistics (-yd) startup parameters. These parameters cause OpenEdge to write memory statistics to the client.mon file. The -yd parameter provides all of the information about memory usage available with -y plus additional information about r-code segments loaded during a client session. For more information about the -yd and -y startup parameters, see OpenEdge Deployment: Startup Command and Parameter Reference.
The following images show sections of client.mon output generated with the -yd startup parameter.
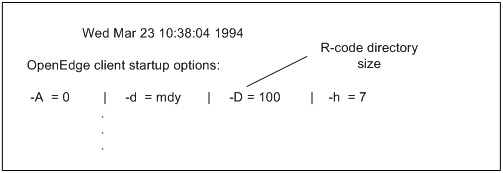
In the following image, the "OpenEdge client startup options" section shows the r-code directory size (-D), in this case, set to the default of 100 entries. The -y startup parameter also generates this information.
Figure 17. OpenEdge client startup options for –yd
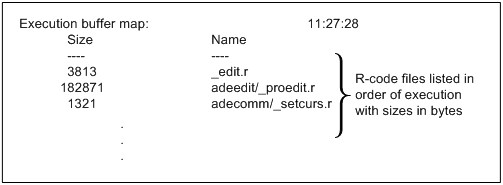
In the following image, the "Execution buffer map" section shows the order and size of procedures loaded into the execution buffer.
Figure 18. Execution buffer map for –yd
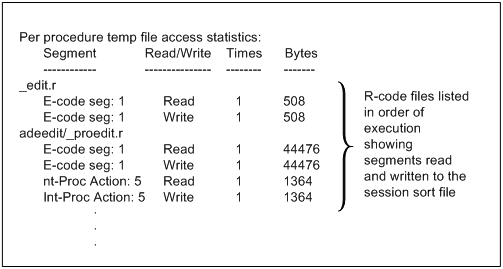
In the following image, the "Per procedure temp file access statistics" section lists each r-code segment that has been read or written to the r-code swap file (.rcd). Each segment is listed under its r-code file by segment type ("Int-Proc Action"), number (5), and size (1364 bytes).
Figure 19. Accessing the r-code swap file for –yd
In this example, all segments shown have been read and written once. A large number of segments read or written a large number of times indicates a likely need for more memory.
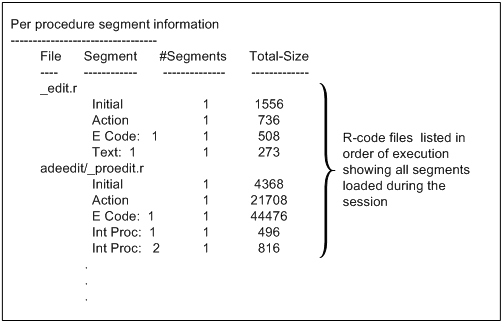
In the following image, the "Per procedure segment information" section lists all the r-code segments loaded during the session. Each segment is listed under its r-code file by segment type ("Int-Proc"), number (2), and size (816 bytes).
Figure 20. Procedure segment information for –yd (Part 1)
Thus, if there are three internal procedure action segments in appedit/_proedit.r, they are listed in order (Int-Proc: 1 through 3). Likewise, multiple main action code segments are listed in order (A-Code: 1 and 2). The number of segments for each entry is always one. Note that the "Initial" segment has no segment number, because there is never more than one of this segment type per r-code file.
In the following image, the listed sections provide memory and segment usage summaries. The -y startup parameter also generates this information.
Table 31. Procedure segment information for –yd (Part 2)
-----------------------------------------
Program access statistics: Times Bytes
.
.
.
Memory usage summary: Current Max Used Limit (Bytes)
Stack usage (-s): 60 7248 40960
Local buffer usage: 864 14704
R-code Execution Buffer: 530025 710609 710656
Segment Descriptors Usage: (numbers)
Max Used: 508 Limit: 720
------------------------------------------------
The "R-code Execution Buffer" statistics show how far your application pushes the execution buffer ceiling. The "Segment Descriptors Usage" statistics shows how close your application is to running out of segment descriptors, and thus, whether you need to optimize the number of r-code segments in your application.