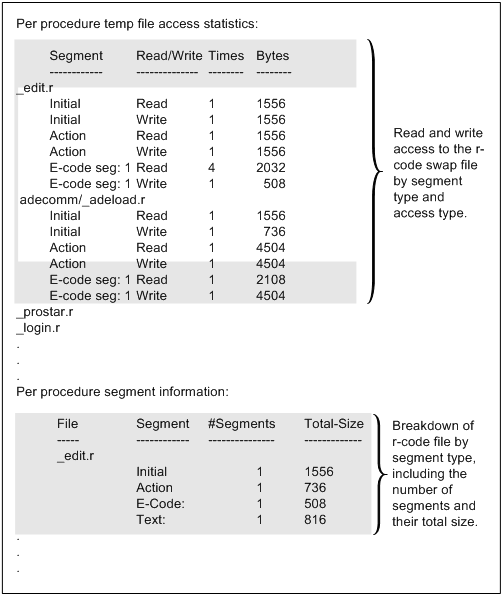
The following image shows a sample excerpt from the output of the Segment Statistics (-yd) startup parameter.
The Per procedure temp file access statistics fields show the swap rates for each segment of each procedure executed during the session. The Per procedure segment information fields show the number and size of r-code segments in each procedure. Use this information to determine how your application design is affecting r-code performance. For more information about application design and r-code performance, see
R-codeFeatures and Functions.