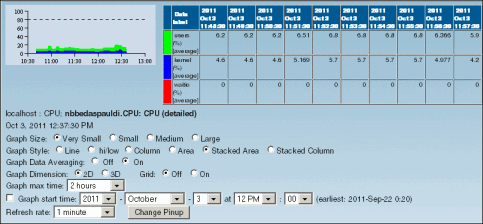
|
Property
|
Options
|
Comments
|
|
Graph Size
|
Very small
Small
Medium
Large
|
If you have a graph with small statistics, you can choose to have the pinup graph larger so you can better see its details.
|
|
Graph Style
|
Line
hi/low
Column
Area
Stacked Area
Stacked Column
|
Depending on the kind of graph you are viewing in the pinup, you can change its style to another recognized style.
|
|
Graph Data Averaging
|
Off
On
|
The default is Off. If you select On, data appears as a weighted average for the time period set for the Graph max time option.Setting this option to On reduces the number of data points displayed.
|
|
Graph Dimension
|
2D
3D
|
Changes the display from 2-dimensional to 3-dimensional.
|
|
Grid
|
Off
On
|
The default is Off.
|
|
Graph max time
|
A number of options, from 5 minutes to 2 days.
|
Controls how much time the graph spans. Note that this value does not affect how often or how much data is collected for graphing.However, the ranges for the specific value options from which you can select are governed by the settings you define for the Graph cache option. For details, see the appropriate section in OpenEdge Management and OpenEdge Explorer: Getting Started.
|
|
Graph start time
|
Select the check box.
Provide year/month/day/ time start time settings.
|
Identifies the start date and time for the graph. The purpose of this start information is to help you drill deeper into the resource activity details recorded for a specific time frame. To select this option, click in the check box on the side left of the field label. Select the year/month/day/time settings from the fields displayed on the right side of the field label.
To ensure a meaning graphing of data, review the Graph cache option and the Graph max time setting values as you determine the value for this start time setting.
|
|
Refresh rate
|
None
15 seconds
30 seconds
1 minute
2 minutes
3 minutes
4 minutes
5 minutes
10 minutes
15 minutes
|
The refresh rate is the rate at which the resource is checked to see if there is more information to put in the graph.
The refresh rate should not be less than the polling rate for the resource. For example, if you set the refresh rate to 1 minute and the polling rate is at 5 minutes, you do not get new graph data every minute; you get it only at the same rate as the polling occurs.
|