Displaying the ABL Error CallStack in the Stack Trace dialog box
To display the ABL Error CallStack in the Stack Trace dialog box:
1. Start a Progress Developer Studio for OpenEdge session.
2. Run the ABL code specified below in Progress Developer Studio for OpenEdge. For more information, see Progress Developer Studio for OpenEdge Help.
Main.p
SESSION:DEBUG-ALERT=YES.
SESSION:ERROR-STACK-TRACE=YES.
Run New.p
/*Error is raised here and displayed on the screen.*/
New.p
ROUTINE-LEVEL ON ERROR UNDO, THROW.
RUN BAR.
/*Error is automatically thrown here due to the UNDO, THROW directive or it
could be caught with a CATCH block and re-thrown with the same effect. */
PROCEDURE bar:
FIND CUSTOMER WHERE Name BEGINS "Z".
/*This fails */
/*Error is automatically thrown here due to the UNDO, THROW directive or it
could be caught with a CATCH block and re-thrown with the same effect. */
END.
3. Compile the code and run it.
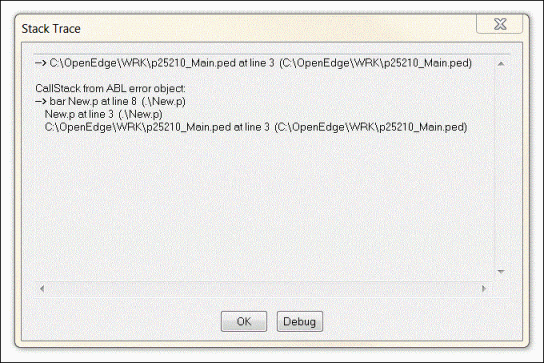
4. Click Help in the Error message box. The Stack Trace dialog box appears. It contains the ABL Stack Trace and displays the CallStack information under the heading "CallStack from ABL error object".
The following figure shows a ABL Stack Trace dialog box with the ABL stack trace.
Figure 10. Stack Trace dialog box including the ABL CallStack
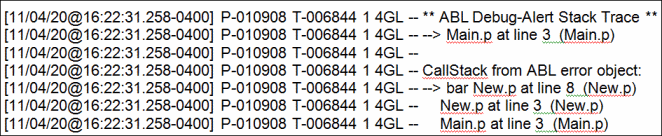
Use the -clientlog startup parameter to enable the display of CallStack information in a log file. Each line of the trace gets prefixed by the standard log file line header. The following figure displays the appearance of CallStack information in a log file.
Figure 11. CallStack information in a log file
For more information on the format of each stack line, see OpenEdge Development: ABL Reference.