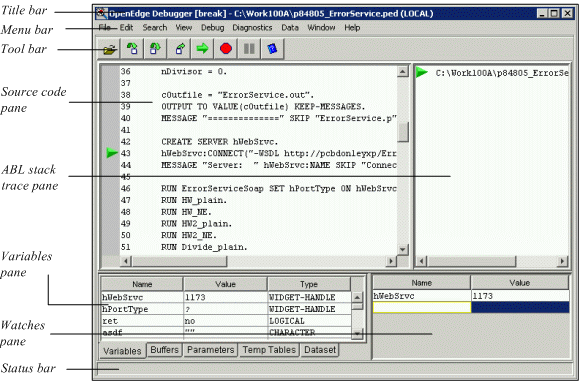
The following figure shows the layout of the Debugger window.
Figure 12. Debugger window
The layout of the Debugger window generally is the same on all supported systems; any significant differences are described in this chapter. The exact dimensions and layout of your Debugger window might differ, depending on the size and resolution of your monitor. However, the general layout of the window is fixed.
The Debugger window contains four panes, as well as a title bar, menu bar, toolbar, and status bar. You can resize the Debugger window like any other window on your system. You can also resize each pane vertically or horizontally in relation to the pane next to it. To resize the panes in Windows, point to the resize bar between the panes. When the pointer changes to a double-headed arrow, drag the resize bar up, down, right, or left. To resize the panes on UNIX, select the resize handles between the panes and drag them up, down, right, or left. Each pane provides scroll bars, as required, to allow you to access portions of the pane that might be vertically or horizontally out of view.
All panes except the source code pane can be hidden. To show or hide a Debugger window pane, select or clear the corresponding menu option on the View menu. For more information, see View menu .
The Debugger automatically saves these window settings and lets you set other Debugger window settings in the Preferences dialog box. For more information, see Preferencesdialog box.
The Debugger updates all panes when it takes control of an executing procedure. For example, the stack trace pane does not reflect the current ABL stack trace while an application is executing; the Debugger updates the stack trace pane only when it encounters a breakpoint or when you step through code.