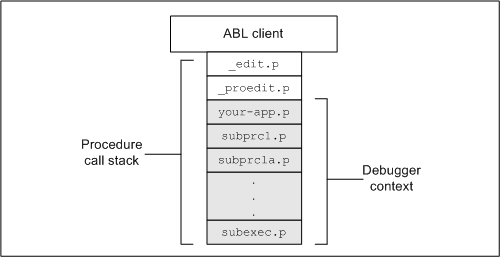
The following figure shows the relationship between active procedures inside and outside the Debugger context in a typical procedure call stack (growing downward in the figure). The Debugger is controlling an application (your-app.p) that is running in the Procedure Editor (also an OpenEdge application). In this figure, the executing procedure is subexec.p. The procedure call stack includes all procedures down to the executing procedure. All procedures running from your application are in the Debugger context. Only procedures associated with the Procedure Editor (_edit.p and _proedit.p) are running outside of the Debugger context.
Figure 2. Procedures inside and outside the Debugger context
An active procedure can run outside the Debugger context in one of the following two ways:
When the name of the procedure is preceded by an underscore (_), as with _edit.p and _proedit.p
When the procedure invokes the Debugger with the DEBUG method of the DEBUGGER system handle
The Debugger keeps track of run-time information only for active procedures inside the Debugger context. The Debugger allows you to examine the data items, object attributes, listing, and execution status of any procedure that is active in the Debugger context anytime the Debugger has control.
You can neither examine data from nor control execution of procedures outside the Debugger context.