Displaying the .NET Stack Trace in the Stack Trace dialog box
To display the .NET Stack Trace in the Stack Trace dialog box:
1. Start a Progress Developer Studio for OpenEdge session. If you want to see the .NET stack trace, the session must be running on Windows.
2. Run the ABL code specified below in Progress Developer Studio for OpenEdge. For more information, see Progress Developer Studio for OpenEdge Help.
USING System.Windows.Forms.*.
DEFINE VARIABLE mainForm AS Form NO-UNDO.
DEFINE VARIABLE form2 AS Form NO-UNDO.
DEFINE VARIABLE dlgForm AS Form NO-UNDO.
DEFINE VARIABLE btn AS Button NO-UNDO.
ASSIGN
mainForm = NEW Form()
mainForm:Text = "Main and Only Form"
btn = NEW Button().
mainForm:Controls:ADD(btn).
btn:Click:Subscribe("BtnClick").
WAIT-FOR Application:Run(mainForm).
MESSAGE "Done" VIEW-AS ALERT-BOX INFO BUTTONS OK.
PROCEDURE btnClick:
DEFINE INPUT PARAMETER sender AS Button NO-UNDO.
DEFINE INPUT PARAMETER args AS MouseEventArgs NO-UNDO.
RUN newForm.
END.
PROCEDURE newForm:
form2 = NEW Form().
WAIT-FOR Application:Run(form2). /* This should fail w/.NET Exception */
END.
3. Compile the code and run it. The Main and Only Form window appears.
4. Click on the button. A .NET exception Error message box appears.
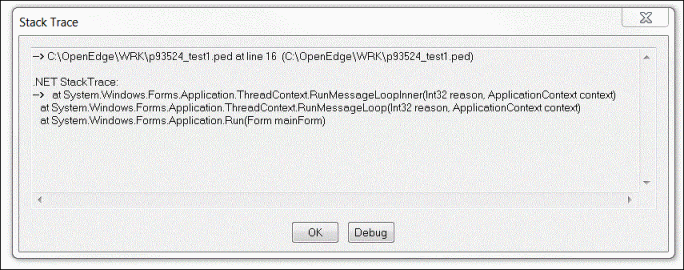
5. Click Help in the Error message box. The Stack Trace dialog box appears containing the .NET stack trace.
The following figure shows a .NET Stack Trace dialog box with the.NET stack trace.
Figure 9. Stack Trace Dialog box including .NET Stack