
|
Column
|
Description
|
|
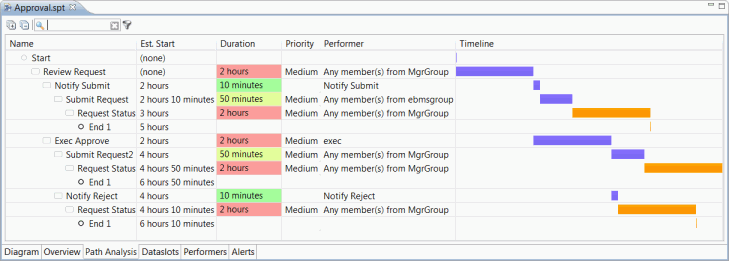
Name
|
Displays the task name, with the adjoining icon indicating the shape used.
|
|
Est. Start
|
Indicates the time interval in which the task is estimated to start. If there is no time interval, this column displays “(none)” (for instance, in the case of the Start workstep). This value is derived by adding the duration for previous tasks. For instance, the estimated start of 4 hours for the Notify Reject task is a sum of the duration for Review Request and Exec Approve tasks. An asterisk beside an estimate (in this case, for “Request Status” and “End1” tasks), indicates that the estimate may not be accurate because there are parallel paths to reach that point..
|
|
Duration
|
Displays the time required to complete the task. The colors representing the duration are indicated as follows and are relative to the duration of the other tasks.
|
|
Priority
|
Displays the workstep priority. Supported values are: Low, Medium, High, Critical, or dataslot name.
|
|
Performer
|
Displays the performer for Activity, Adapter, and Subprocess worksteps.
|
|
Timeline
|
Provides a visual representation of the Estimated Start and Duration data for each task, without displaying the actual numbers. Each timeline starts from the Estimated Start value and continues for the specified Duration. The timeline is tabulated based on the total process time (in this case, 6 hours) with each task timeline representing the work breakdown structure. Timelines also depict the dependencies between tasks (that is, a particular task cannot start before another task is completed). If the timeline for a particular task is displayed in orange (in this case, the Request Status task), it indicates that the estimated start time may not be accurate because there are parallel paths to reach that point..
|
 ) icon. To collapse the list, click the Click to collapse all nodes (
 ) icon.
 ), the Path Analysis view displays only those paths that contain the keyword you have searched.
 ) icon.