Kibana is an Elasticsearch product that enables you to visualize your Elasticsearch data through a browser. You can use it to view and analyze your PAS for OpenEdge log messages that are stored in Elasticsearch.
Install Kibana
You can either install Kibana on-premise or, if you are using the Elasticsearch Cloud Service, access it directly by logging in through a browser.
If you are installing Kibana on-premise, download the Kibana installation package for your operating system from the Kibana downloads page. Then, install Kibana by following the instructions for your operating system as described in the Kibana installation documentation.
Configure Kibana
The Kibana installation directory contains a file named kibana.yml in the config folder. Edit this file in a text editor and set the following properties to enable Kibana to connect to your Elasticsearch server:
After you have configured Kibana, start it by following the instructions for your operating system as described in the Starting and stopping Kibana documentation.
For example, in Windows, run ./bin/kibana.bat in a command line console.
Launch the Kibana web application
Kibana provides a web application to enable you to view your PAS for OpenEdge logs in a browser. Once Kibana is up and running, you can launch the web application by entering its URL http://<hostname>:<port> in a browser (http://localhost:5601 by default).
Note: To change the default port, modify the server.port setting in the kibana.yml file and restart Kibana.
Create index patterns
Elasticsearch creates indexes on the data that it stores. Before you can view your PAS for OpenEdge logs in Kibana, you must define index patterns that match the index names of your log data in Elasticsearch.
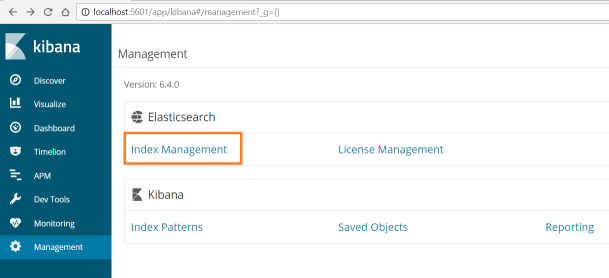
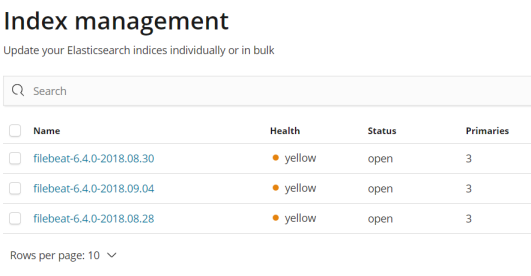
To see a list of all Elasticsearch indexes, click Management in the Kibana web application's left pane and then Index Management.
Because your log data is sent by Filebeat, Elasticsearch creates index names with the pattern filebeat-<filebeat_version>-<date>.
To view your PAS for OpenEdge logs, you must specify index patterns that match one or more of these indexes.
Depending on your needs, you may want to create multiple index patterns. For example, filebeat-* would fetch all Filebeat-based indexes, while filebeat-6.4.0-2018.08-* would fetch all Filebeat-based indexes created in the month of August, 2018.
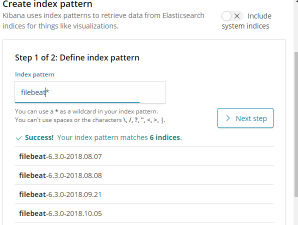
Follow these steps to create an index pattern in Kibana:
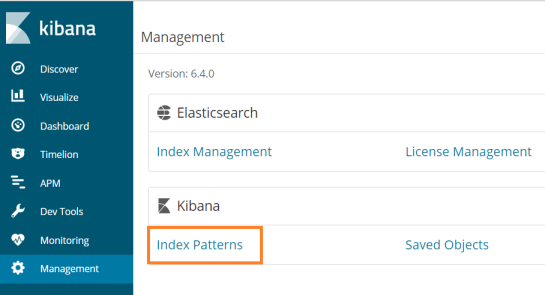
1. Click Management in the left pane and then Index Patterns.
2. On the Index Patterns page, click +Create Index Pattern.
3. Enter the pattern in the Index pattern field. Kibana displays all indexes that match the pattern right below your entry.
4. Click Next step.
5. In the Configure settings page, select a Time Filter field.
Note: The @timestamp option enables you to filter log messages by time intervals. This is useful when you are troubleshooting.
6. Click Create index pattern.
View PAS for OpenEdge logs
The Discover, Visualize, Dashboard, and Timelion features in the left pane enable you to view and analyze your log data in different ways.
Example
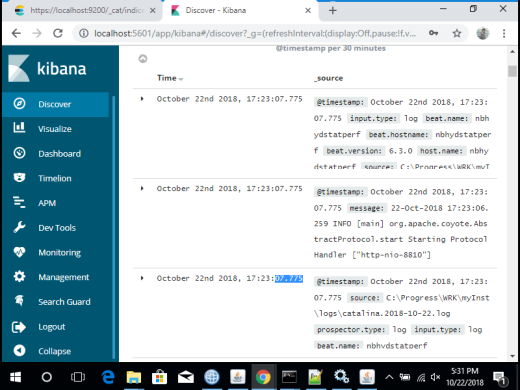
The Kibana documentation provides detailed descriptions of each feature but here is an example of how you could use the Discover feature to help you get started.
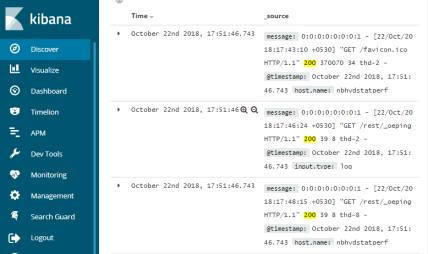
Click Discover and select an index pattern from the dropdown on the top left (under Add a filter). Based on the settings, all log messages that map to the index pattern are displayed.
A list of all available fields is displayed on the left. The message field contains a log message from one of your log files. Let's assume that you are troubleshooting and want to search for a particular type of message. For example, all messages that have the following stack trace line:
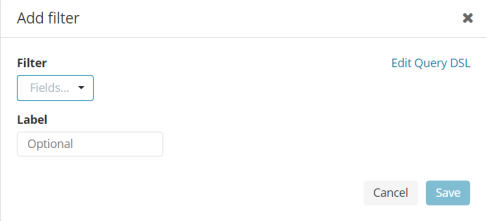
To do this, you need to specify a filter query. Elasticsearch provides a JSON-based query domain specific language (DSL) that enables you to write filter queries. Click Add a filter+ and then Edit Query DSL.
Enter the JSON query, specify a label to identify it, and click Save:
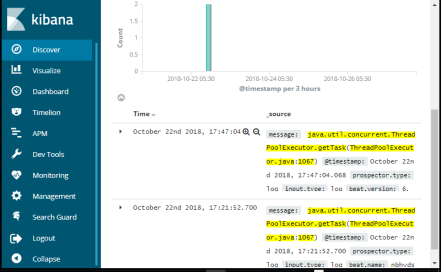
Only those log messages that fall within the selected index pattern and that pass the filter query are displayed:
You can drill down into each log message, add multiple filters based on a wide range of fields, and perform a host of other analytical and troubleshooting operations.
Additional resources
For more information on the visualization capabilities of Kibana, see the Kibana User Guide.
For more information on the Elasticsearch query language, see the Query DSL documentation.