Google Analytics is a service that generates detailed statistics about a website's traffic and traffic sources. But Google Analytics is not just a database. It is a multi-dimensional hypercube containing all kinds of measurements about traffic to a website.
When you connect to Google Analytics using Hybrid Data Pipeline, you can reach into this repository and flatten it into relational data that can be used with any ODBC or JDBC application.
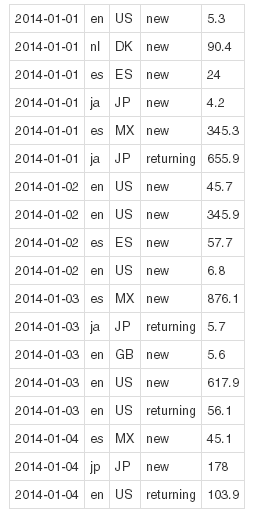
Imagine a very small store of data about your website. For each hit, the Analytics software logs the date, language of user, country of origin, new or returning user, and their time on the site (in seconds).
Google Analytics collected data for our little web site over four days. The data is broken down by date, language, country and user type. And for each visit, we recorded the time spent on the site.
You can look at the time on site as a measurement or metric, and all of the other columns as dimensions.
Google Analytics works like our example. It aggregates information from your website, but measures hundreds of things, and categorizes them by hundreds of dimensions.
The query interface that Google provides allows you to fetch these metrics and group them. Because of the massive amount of information they store, their interface limits you to fetching at most ten metrics at a time, and grouped by no more than seven dimensions.
Creating a query
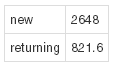
Suppose you want to know how much time new visitors spent on the site. Your dimension is user type and your metric is time. You would get back two rows:
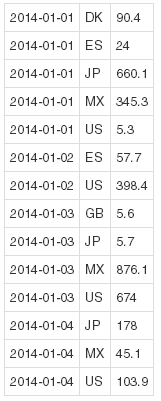
How much data you get back depends on how you ask for it. If you ask for two dimensions, you get even more data, because you get one row per permutation. Requesting how much time users have spent on each day, broken down by country, returns more rows:
Google Analytics Dashboard
This section assumes you have access to a Google Analytics Dashboard.
An outline of your views into your web properties appears. Choose a view and you see the Audience Overview, a graph with other metrics showing Sessions, Users, Pageviews, Pages/Session, Average Session Duration, Bounce Rate and Percent of New Sessions. In the lower right is a breakdown of sessions by language.
The DataDirect Hybrid Data Pipeline connectivity service defines a table called Overview for your Google Analytics Data Store that provides similar information. After connecting to Google Analytics, you can use the following query to give you the same numbers as the Audience Overview.
SELECT * FROM Overview WHERE viewId = 'ga:12345678'
You can copy the viewId from the URI in your browser. The URI will end in something like this: /visitors-overview/a99999999w00000000p12345678/. Copy the digits after the final "p", and prefix them with a "ga:" as the viewId.
VIEWID
SEGMENTID
STARTDATE
ENDDATE
_BROWSER
_OPERATINGSYSTEM
ga:12345678
NULL
"2014-01-01"
"2014-01-30"
NULL
NULL
A simpler way to get the result is to use the defaultView connection option in your connection string. The name of the view is generally displayed in view control on the General tab of the setup dialog. Include that name in the defaultView connection option, and the connectivity service will look up the viewId for you. For example, if your view were named "web.mycompany.com blog", you could use the following connection string:
Connection c = DriverManager.getConnection
("jdbc:datadirect:googleanalytics:configOptions=(defaultView=web.mycompany.com blog);clientid=XXX;clientsecret=YYY;refreshtoken=ZZZ");
Now your query is simpler:
SELECT * FROM Overview
The remaining examples assume that you made this change.
To make the difference between metrics and dimensions a little more clear, in the driver we prefix all dimensions with an underscore.
Note that only one row was returned, and all of the dimensions came out as NULL. We have a special rule that says if you ask for all dimensions, like we just did with the SELECT *, then we get no dimensions. These values would match exactly what we see in the Google Analytics Audience Overview.
If we ask for the same set by language:
SELECT _LANGUAGE,SESSIONS FROM Overview
we get exactly what was in the lower-right corner of that dashboard page.
Overview table
The entire data store of Google Analytics is available in a hidden table called Data. The Overview table is actually a small view into the Data table that has selected metrics and dimensions that are useful together.
Other tables, which are also subsets of Data, come predefined. These tables are listed on the Google Analytics Pseudo Tables page.
By default, the actual underlying Data table is hidden. The Data table has over 100 metrics and dimensions, Google limits the number of metrics (to 10) and dimensions (to 7) for each query. Hiding the table makes it less likely that users will submit a query such as SELECT TOP 10 * FROM DATA, which could return results that are not very useful.
The Data table can be made visible by adding showInternalTables=1 to the Map Options.
After doing that, the following query would work the same way as the SELECT FROM Overview query.
SELECT _LANGUAGE,SESSIONS FROM Data
Adding your own tables
Usually, you don't need to expose the Data table, because new pseudo-tables can be added with the addTables configuration option. Suppose you wanted to define a table that let you query sessions only by language and country. This piece of JSON defines the new table:
{"MyTable":["sessions","_language","_country"]}
You can add it to your connection string using the reference controls on the dialogs.
This adds a new pseudo-table named MyTable, and it now has three columns, plus the "automatic" columns of viewId, segmentId, startDate and endDate. Now instead of doing what we did, we can do the functionality equivalent:
SELECT _LANGUAGE,SESSIONS FROM MyTable
Because of this, it is typically not necessary to expose the Data table. (Note that we could have defined this table as just based on sessions and language. But remember the earlier rule that said that if you request all dimensions, we behave as if you had selected none. This means that both SELECT _LANGUAGE,SESSIONS and SELECT * would have all referenced one dimension, and therefore, it would have not broken the data down by language. There is no harm in adding extra dimensions to your definition.)
Defining the columns
You can use the Metadata table to define the columns in your pseudo-table. The Metadata table has the list of all of the metrics and dimensions. Use only the metrics and dimensions that are marked with a "PUBLIC" status. The Hybrid Data Pipeline connectivity service ignores metrics and dimensions with a "DEPRECATED" status, unless showDeprecatedObjects=ON is added to the config options.
Not all combinations of metrics and dimensions are valid. Refer to the table called Incompatible. If you see a row in that table that contains both columns, it means they can't be used in the same query.
Support for custom variables, metrics, and dimensions
Custom Variables are defined on the client, and are basically key=value pairs. There are 5 available (50 for premium). They are set in the webpage by calling methods defined in ga.js. They are used only for Google Analytics before the upgrade to Universal Analytics.
Custom Metrics and Dimensions are defined solely on the server, and the names are available as metadata. There are 20 (200 for premium) of each available. They replace the concept of custom variables when the web properties are upgraded to Universal Analytics.
If you need access to three of the new tables, AccountUserLink, WebpropertyUserLink, and/or ProfileUserLink, your refresh token may have to be regenerated to get the new permission.