Corticon Web Console maintains a log of its activities. The log includes:
User actions such as deploying or undeploying Decision Services and creating or modifying Applications and Servers.
System events such as deployment failures and lost connections to Servers.
To view the activity log:
1. Connect to the Web Console server where you want to view the Activity Log.
2. Click the Activity Log icon:
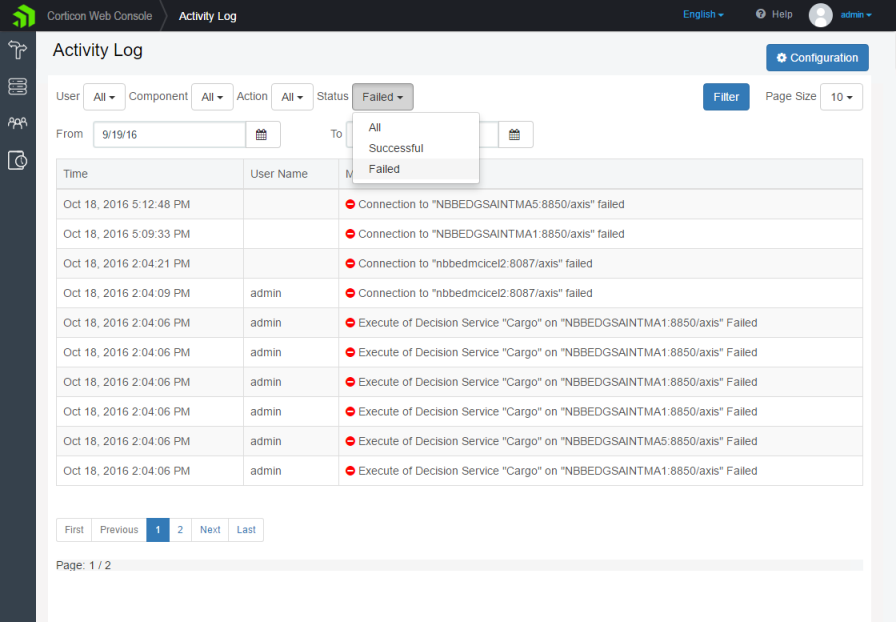
The Activity Log page opens and displays the log in a three-column table:
Some log messages, such as those relating to failed deployment of Decision Services, have additional information about the problem that is not displayed in the table. To view this information, hover over a Failed log message, and then click on the information icon at the end of that line. An alert opens with additional information on the issue.
You can filter the table to view a subset of the log messages. To do this, select the filters you want from the drop-down lists, and then click Filter. For example, to view all failed Decision Services deployments by a user, select the username from the User drop-down, select Decision Service in Component, select Deploy in Action and finally, select Failed in the Status drop-down. You can also add a date range to the filter to narrow the information to only log messages recorded between specified dates.
The Web Console maintains this log for a configurable period of time. This setting is visible only to Web Console Administrators. To know more about configuring the Activity Log, see the topic Configuring the Activity Log.


 at the end of that line. An alert opens with additional information on the issue.