When working on large Ruleflows you often want to know the dependencies between the nodes in the Ruleflow. This can help you determine how best to order the nodes or detect unanticipated dependencies. Dependencies are identified by the attributes that are set or referenced in the nodes of a Ruleflow. You also often want to know how one or more attributes are used in a Ruleflow. Ruleflow graphing lets you see the dependencies and where attributes are used. This is useful for understanding a Ruleflow, debugging problems, and performing impact analysis when changing a vocabulary.
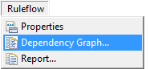
With the Ruleflow you want to graph open in its Studio editor, select the Ruleflow menu command Dependency Graph, as shown:
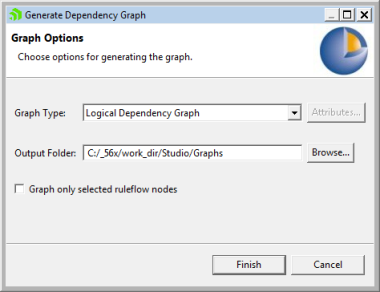
The Generate Dependency Graph dialog box opens:
Choose the type of graph you want, and the output folder. You can focus the analysis on just nodes you selected before opening the dialog, or all nodes on the Ruleflow canvas.
Note: When no objects on the Ruleflow canvas are preselected, the option to graph only selected nodes has no effect.
Attribute Dependency Graph
An attribute dependency graph shows the attributes that establish dependencies – that is, when a Rulesheet uses an attribute set by another Rulesheet, the former has a dependency on the latter.
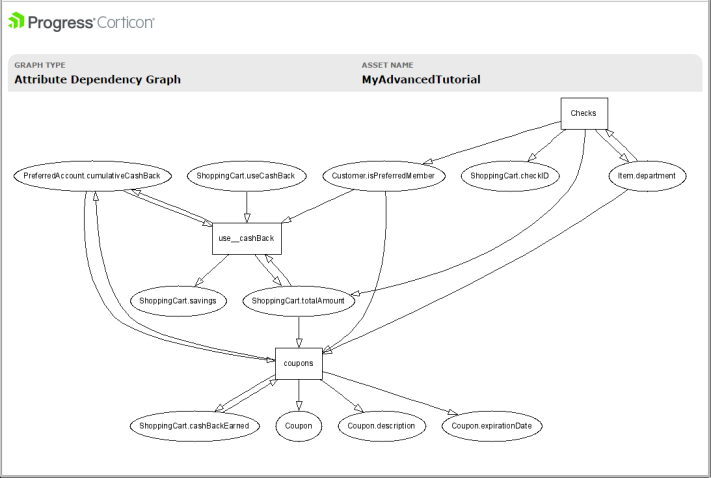
When you just generate a graph right away, all the attributes are included, as in this graph of the advanced tutorial's Ruleflow:
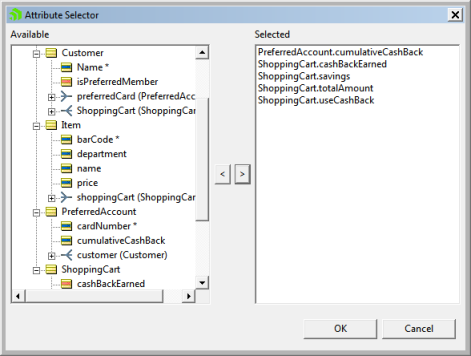
For large projects, graphs with all the attributes and dependencies can be difficult to work with. You can specify that only selected attributes are to be analyzed. Click Attributes to open the Attribute Selector dialog box, as shown:
In this illustration, five attributes were selected, so clicking OK returns to the graph options where clicking Finish generates the graph.
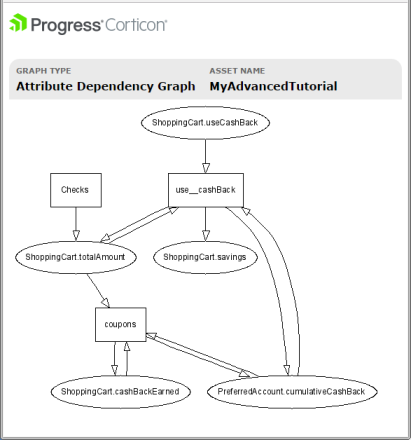
The graph opens in your default browser, as illustrated:
The graph image and its supporting files are saved in the output folder.
Note: When you next generate an attribute graph from the same Ruleflow, it overwrites the existing file unless you relocate generated files or specify unique output folders.
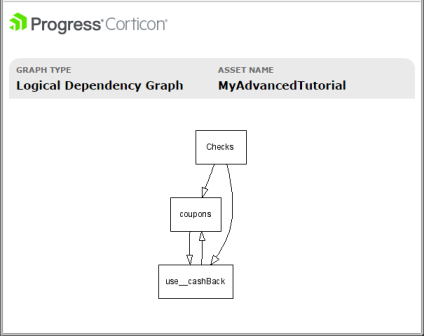
Logical Dependency Graph
A logical dependency graph shows the dependency between the Rulesheets in a Ruleflow. Change the graph type to Logical Dependency Graph, as shown:
You can set the output folder to your preference and if Ruleflow nodes were selected before opening the dialog box, the analysis is limited to those nodes. The option to specify attributes is not relevant and not available.
Clicking Finish generates the graph. The following illustration is the logical dependency graph for the Life Insurance sample's iSample_policy_pricing.erf:
The graph image and its supporting files are saved in the output folder.
Note: When you again generate a dependency graph from the same Ruleflow, it overwrites the existing file unless you relocate generated files or specify unique output folders.